
Performance and leaderboards
Reading the training dashboard — progress, badges, score by dimension, and coaching priority.
Analytics → Training, or the Performance link on any plan. Pick the plan from the dropdown; the dashboard is per-plan.
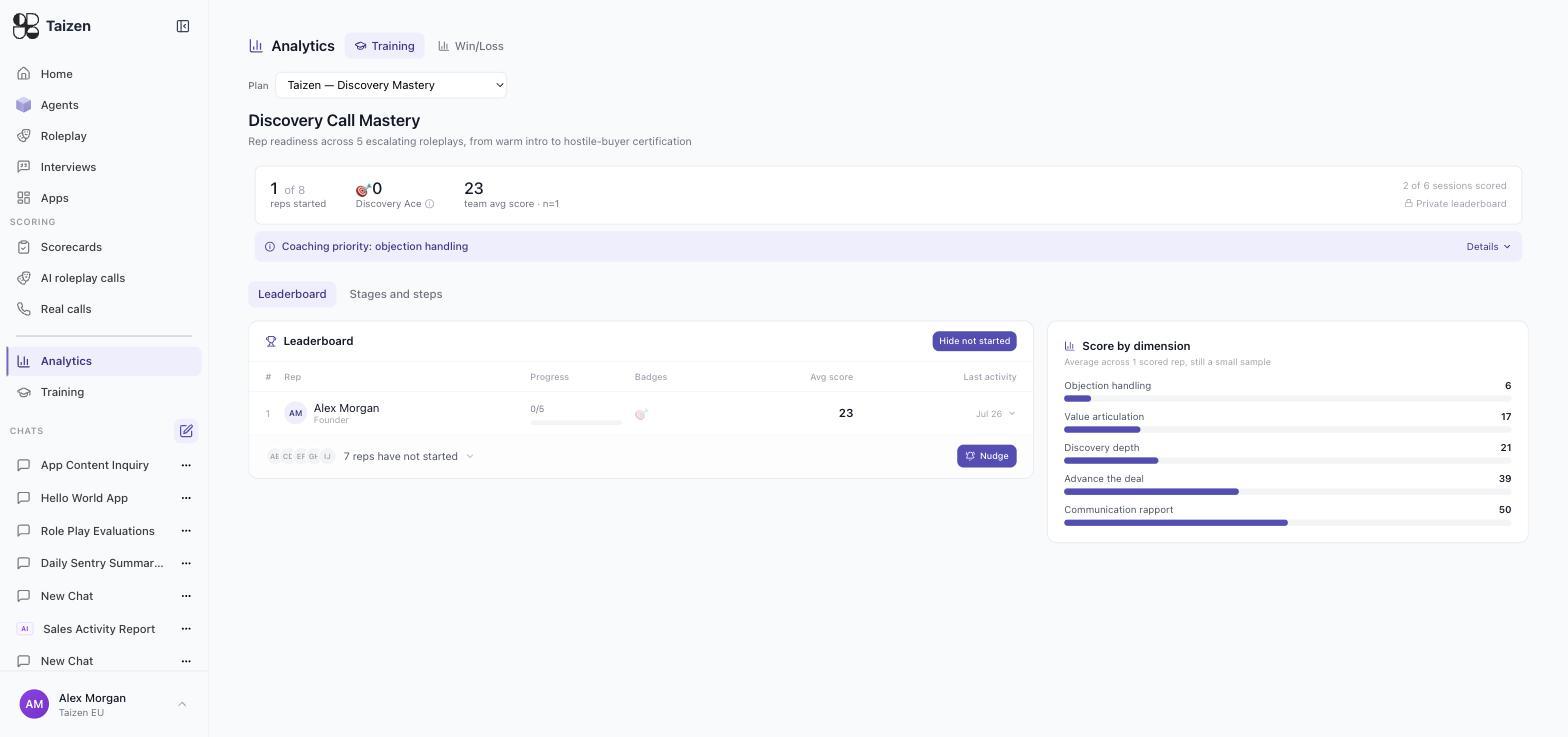
The header numbers
| Number | What it means |
|---|---|
| Reps started | How many of the assigned reps have begun, out of the total assigned |
| Certifications | How many have completed the plan's certification stage |
| Team average score | Mean across scored sessions, with the sample size (n=) shown |
| Sessions scored | How many sessions are in the average, out of how many exist |
Watch the sample size. A team average built on n=1 is one rep's bad morning, not a team signal — the
dashboard says so explicitly, and you should believe it.
Coaching priority
A single call-out at the top of the dashboard: the dimension the team is weakest on, e.g. "Coaching priority: objection handling". Expand it for the detail.
This is the most useful thing on the screen. It answers "what should I work on with the team this week" with one dimension instead of a table.
Leaderboard
Per rep: progress through the stages (0/5), badges earned, average score, and last activity. Reps who
haven't started are collapsed into a separate row with a Nudge action.
Two patterns to look for:
- Progress without score improvement — passing gates by attrition. Read their evidence.
- High score, no progress — the rep aced stage 1 and stopped. Usually means nobody told them the plan was expected of them.
The leaderboard can be private. Public leaderboards motivate the top third and demoralise the bottom third; private ones keep the diagnostic value without the theatre. Choose deliberately.
Score by dimension
Average across scored reps, per dimension of the plan's scorecard — objection handling, value articulation, discovery depth, advancing the deal, communication rapport.
Read it as a shape, not five numbers. A team that's strong on rapport and weak on objection handling is a team that's liked and losing, and that diagnosis changes what you coach.
Stages and steps
The other tab: the plan as reps experience it, with where they're stalling. If two thirds of the team stalls on the same stage, the stage is the problem — either the bar is wrong or the material never taught what the stage tests.
Closing the loop with real calls
The training dashboard tells you about practice. Scoring → Real calls tells you about the job. The comparison is the point:
- practice up, real up → keep going
- practice up, real flat → they're learning the bot; change the scenarios (build a plan)
- real up, practice flat → the plan isn't testing what the job requires
A rising practice average on its own is evidence that reps are engaging; the real-call score is what shows behaviour changed. See score real calls.
Win/Loss tab
Analytics → Win/Loss is the other half of the analytics screen: outcomes, competitors and themes from interviews. Weakness in a training dimension and a recurring theme in lost-deal interviews are usually the same problem seen from two ends.